pyplotter 1 2 3 4 5
pyplotter 1 2 3 4 5 --show-min-max --padding 1 --title testing --height 3
pyplotter -h
import pyplotter as pyplotter
data = range(1, 22)
labels = map(str, data)
title = "My cool graph"
graph = pyplotter.Graph(data=data, labels=labels, title=title)
pyplotter.Plotter.plot(graph, show_x_axis=False, padding=1)
My cool graph
                    ▁ ▁ ▂ ▂ ▃ ▄ ▄ ▅ ▆ ▆ ▇   -- Max: 21
▁ ▂ ▂ ▃ ▄ ▄ ▅ ▆ ▆ ▇ ▇ ▇ ▇ ▇ ▇ ▇ ▇ ▇ ▇ ▇ ▇   -- Min 1
Data range: 1 - 21

pyplotter.Plotter.plot(graph, show_x_axis=True, tail=5)  # last 5 elements
My cool graph
                    ▁         ▄         ▇   -- Max: 21
▁         ▄         ▇         ▇         ▇   -- Min 17
<17>[17]  <18>[18]  <19>[19]  <20>[20]  <21>[21]
Data range: 17 - 21
from pyplotter import Graph, Plotter
from pandas.io.data import DataReader
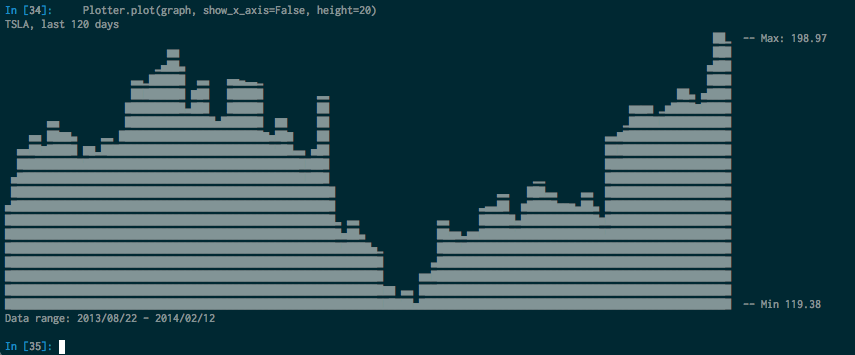
title = "TSLA, last 120 days"
df = DataReader("TSLA", "yahoo", start="2013/06/01").tail(120)
dates = [d.strftime("%Y/%m/%d") for d in df.index.date.tolist()]
data = df.Open.values.tolist()
graph = Graph(data=data, title=title, labels=dates)
Plotter.plot(graph, show_x_axis=False, height=20)
help(pyplotter.Plotter.plot)
plot(graph, show_x_axis=True, head=None, tail=None, label_length=4, padding=0, height=2, show_min_max=True, show_data_range=True, show_title=True)
    show_x_axis: Display X axis
    head: Show first [head:] elements
    tail: Show last [-tail:] elements
    padding: Padding size between columns (default 0)
    height: Override graph height
    label_length: Force X axis label string size, may truncate label
    show_min_max: Display Min and Max values on the left of the graph
    show_title: Display graph title (if any)
    show_data_range: Display X axis data range

pyplotter.Plotter.plot(graph, show_x_axis=False, padding=1, height=10)
Another example
                                            ▇       ▁         -- Max: 50
▃                       ▄   ▅               ▇       ▇
▇     ▁           ▁     ▇   ▇ ▇       ▂ ▇   ▇     ▁ ▇   ▇
▇     ▇     ▆ ▆   ▇ ▄   ▇   ▇ ▇     ▅ ▇ ▇   ▇     ▇ ▇   ▇
▇     ▇     ▇ ▇   ▇ ▇   ▇   ▇ ▇     ▇ ▇ ▇ ▆ ▇ ▂ ▁ ▇ ▇   ▇
▇     ▇     ▇ ▇   ▇ ▇   ▇   ▇ ▇     ▇ ▇ ▇ ▇ ▇ ▇ ▇ ▇ ▇   ▇
▇   ▄ ▇   ▇ ▇ ▇   ▇ ▇   ▇   ▇ ▇     ▇ ▇ ▇ ▇ ▇ ▇ ▇ ▇ ▇ ▂ ▇
▇   ▇ ▇ ▆ ▇ ▇ ▇ ▄ ▇ ▇ ▇ ▇ ▄ ▇ ▇     ▇ ▇ ▇ ▇ ▇ ▇ ▇ ▇ ▇ ▇ ▇
▇ ▃ ▇ ▇ ▇ ▇ ▇ ▇ ▇ ▇ ▇ ▇ ▇ ▇ ▇ ▇     ▇ ▇ ▇ ▇ ▇ ▇ ▇ ▇ ▇ ▇ ▇ ▇
▇ ▇ ▇ ▇ ▇ ▇ ▇ ▇ ▇ ▇ ▇ ▇ ▇ ▇ ▇ ▇ ▄ ▁ ▇ ▇ ▇ ▇ ▇ ▇ ▇ ▇ ▇ ▇ ▇ ▇   -- Min 2
- When the markdown file is displayed as HTML, the bars do not align due to the spaces
