data-driven styles #249
Comments
|
Will we support scales within scales (e.g. |
That sounds equivalent to multiple input values, so no, not planning to. Do you have a specific use case for that? |
|
Hypsometric tinting example (made up colors): |
|
👍 |
|
@jfirebaugh I know we talked a bit about how our piecewise-constant scales ≠ d3 quantize (according to d3 docs) — did you have any more thoughts on how we should map those to new spec types? |
|
(I want to pull at least the first part of this work into the v8 spec) |
|
We may need to look at real-world usage of piecewise-constant functions. They don't map to |
|
Food for thought, in preparation for this upcoming sprint: So far we've mainly been discussing data-driven styles as a need for creating data visualizations like chloropleths. @jfirebaugh and I chatted a few weeks ago about the potential for data-driven styles to also impact basemap styling. I've outlined some examples of features in basemaps (specifically ones using our data sources) that might benefit from arbitrary property functions. The main limitation of our proposed implementation is that you cannot also style that property by zoom-level. Although this is mainly a concern for basemap styling, I think this will be a limitation for certain data visualizations as well. |
|
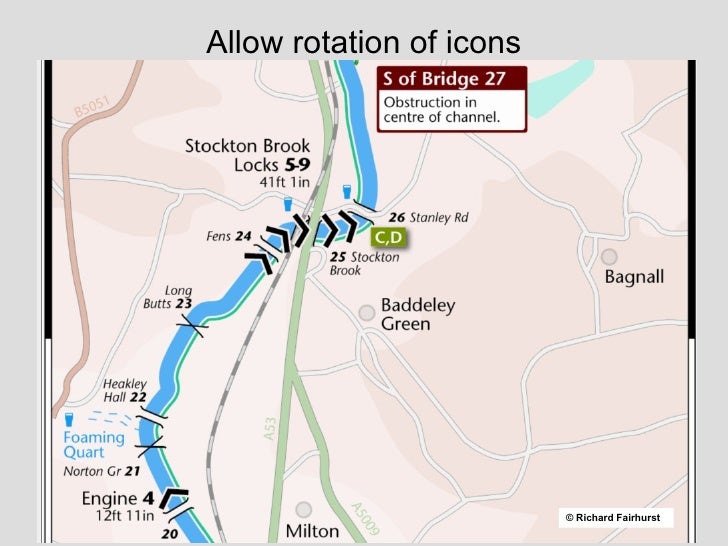
(Really looking forward to be able to do a "icon-rotate": "${rotate}" to rotate my icon based on the rotate attribute. That will be super fun! :) See #320 and mapbox/mapbox-gl-js#873) |
|
@halset Yes, I'd love |
|
Are you guys also considering separating the geometry from the attribute info; similar to http://bl.ocks.org/mbostock/4060606 which would make it easier to do standard deviation and quantile calculations on the entire set. |
|
@stvno not entirely: unlike untiled data, we can't rely on just feature indexes to join data. But we're tinkering a lot right now with joining data to existing vector tiles based on stable IDs, like OSM IDs or something similar. Initially we might do so at the server level, but I imagine it should be implemented on both levels so you can also dynamically join tabular data to features in the client. |
|
Awesome work so far! Is there a better ticket for tracking milestone progress on this? aka, what's done already, what's not, and if so, what can we do to help? |
|
Hey guys! Any updates on this at all? We've recently been trying to use tokens for |
|
mapbox-gl-js implementation is being tracked in mapbox/mapbox-gl-js#1932 |
|
Any update on this? I see that @lucaswoj linked to progress in Mapbox GL JS, but that's only for |
|
@tsemerad Search for "data-driven styling" in the Style Reference to see which properties are supported in which versions. |
|
Thank you. So it looks like iOS and Android don't support them yet. For those interested in tracking iOS and Android support for data-driven styling, watch this ticket. |
|
If I understand correctly, data-driven styles are on feature/property basis. Is there currently a way to achieve that? |

|
@roesneb see mapbox/mapbox-gl-js#4095. Current workaround is probably segmenting the line into many small features, though that has unwanted side effects. Correct current dds is per feature. |
|
@roesneb I came up with the same solution than @andrewharvey. It works quite well, should scale up (if you use one single layer with a geojson featureCollection and one Feature per segment that hold the elevation information), but side effects may occur. See https://jsfiddle.net/7hntLv7y/8/ for a MWE (you'll need to fill in your access token). |
This ticket summarizes my current thinking on data-driven styles based on @lucaswoj's prototype in mapbox/mapbox-gl-js#1012 and mapbox/mapbox-gl-function#1, and discussions in the following tickets:
We're going to enable data-driven styles via an expansion and rationalization of the existing function datatype, drawing on concepts from D3 Scales and the declarative grammar established for them by vega.
This will require pretty extensive changes to the style specification and renderers.
Style spec changes
GL style functions currently support only one kind of input: numeric zoom level. No other parameters or types may be used to specify the domain. Additionally, only simple piecewise linear or exponential mappings are supported.
Data-driven styles require the extension of functions to support:
These extensions will make GL "functions" almost exactly equivalent to what D3 and vega call scales, and I suggest we rename the GL concept to match. I'm going to use the term "scale" for the rest of this description.
1 will be implemented by adding a required
"property"property to the scale declaration. The value is the name of a vector data property to be used for the input domain, or the special value"$zoom"to indicate current zoom level input (or current tile zoom, for layout properties). In the future we may consider adding additional special values such as"$type","$center","$bearing", etc.2 and 3 will be implemented by adding a required
"type"property to the scale declaration, standardizing on the D3/vega scale types that correspond to GL's existing function types, and adding an"ordinal"scale type for the support of discrete input domains. The"linear","pow", and"quantize"scale types cover the current functionality of our"interpolated"and"piecewise-constant"function types, and for them we'll adopt the implementation semantics that D3 uses. This will probably result in some slight differences in things like how out-of-domain inputs are handled, but hopefully no major breakage, and I'm optimistic that existing styles can be mechanically migrated.Renderer changes
The major rendering change will be adjusting to the fact that rendering properties will become per-feature (and therefore per-vertex) attributes when a data-valued scale is used. For layout properties, this doesn't pose much of a challenge -- because some layout properties support token interpolation they are already assumed to be per-feature, the layout code already has direct access to feature data, and the output of the layout phase is GL buffers which are effectively static once calculated.
For paint properties, it's a different story:
gl.vertexAttrib[1234][fv]for$zoom-valued scales.$zoom-valued scales.The performance impact of data-valued paint properties will need to be carefully monitored, but in @lucaswoj's prototype performance is encouragingly good.
Sequencing work
Here's what I'm seeing:
interpolatedandpiecewise-constantfunction types tolinear,pow, andquantizescales, along with corresponding migrations and style updates. But support only$zoom-valued scales.gl.vertexAttrib[1234][fv].That gets us no changes in effective functionality, but the right base to begin adding it.
ordinalscale type and data-valued scales in mapbox-gl-scale.Out of scope
Here's what we aren't going to do, at least right now:
"expression"scale type defined by a grammar similar to filters, I want to see if it's really necessary.The text was updated successfully, but these errors were encountered: