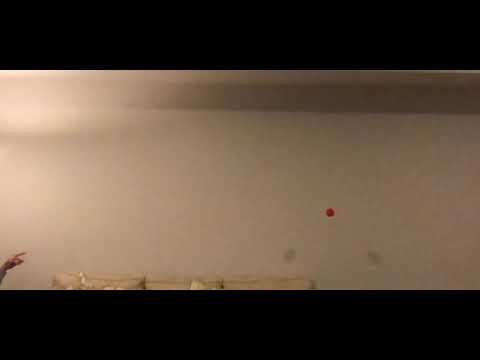
Problem 1: In the given video, a red ball is thrown against a wall. Assuming that the trajectory of the ball follows the equation of a parabola:
-
- Detect and plot the pixel coordinates of the center point of the ball in the video. [10] (Hint: Read the video using OpenCV’s inbuilt function. For each frame, filter the red channel)
-
- Use Standard Least Squares to fit a curve to the extracted coordinates. For the estimated
parabola you must,
a. Print the equation of the curve. [5]
b. Plot the data with your best fit curve. [5]
Assuming that the origin of the video is at the top-left of the frame as shown below, compute
the x-coordinate of the ball’s landing spot in pixels, if the y-coordinate of the landing spot is
defined as 300 pixels greater than its first detected location. [10]

 https://drive.google.com/file/d/1kP5n9sWoRFbt2p3_lJAqz86Zcp1QC5jF/view?usp=drive_link
https://youtu.be/VObA5VUwynI
https://drive.google.com/file/d/1kP5n9sWoRFbt2p3_lJAqz86Zcp1QC5jF/view?usp=drive_link
https://youtu.be/VObA5VUwynI
- Use Standard Least Squares to fit a curve to the extracted coordinates. For the estimated
parabola you must,
a. Print the equation of the curve. [5]
b. Plot the data with your best fit curve. [5]
Assuming that the origin of the video is at the top-left of the frame as shown below, compute
the x-coordinate of the ball’s landing spot in pixels, if the y-coordinate of the landing spot is
defined as 300 pixels greater than its first detected location. [10]
This projects consists of the following code files
- Problem #1:
- redball_trajectory.py
- Problem #2:
- covariance_surf_normal.py
- lstq.py
- tsl.py
- ransac.py
- Add the header to the 3 given columns as 'x','y','z' respectively
-
Ensure the following depenancies are installed
pip install pandas pip install numpy pip install scipy pip install matplotlib pip install opencv-python -
Ensure that the above programs are downloaded into the same folder containing 'pc1.csv' and 'pc2.csv' files
-
Run the programs individually to check the outputs.
-
For lstq.py, tsl.py, ransac.py, you may need to change the file name for two different datasets.
python3 <file_name>
- On running each of the proframs, the output either pops out a plot or a video in individual window. The outputs can be correlated with the outputs shown in the report.
