Kibana 3 talks directly to Elasticsearch from the browser #240
Comments
|
Do you have any indexes beginning with logstash- in es?
|
|
No i don't have anything like that in my ES server..... |
|
Loaded up the latest 3.0.0 milestone 2 release. I'm having the same issue. I pulled up Fiddler to see what was going on. As you can see Kibana tries to directly access elasticsearch on 9200 |

|
Ok my issue was fixed my changing the port from 9200 to 80 in the config.js since I'm using the nginx proxy. Disregard. Thanks and it looks great! |
|
Hi i resolved the above issue can u give solution for this error "error": "FacetPhaseExecutionException[Facet [0]: (key) field [@timestamp] not found]" |
|
It would appear you do not have an @timestamp field, which is what you currently have configured for the histogram. Note that kibana ships configured for logstash by default. As I have no way of telling what sort of data you would have, I can not predict the fields you would want to use. |
In case getnameinfo() fails to resolve an address, it automatically returns
the numeric IP address without setting an error condition, which messes up
the logic in resolve_sockaddr() and causes the IP address to be truncated if
use_fqdn() is set to no.  This patch instructs getnameinfo() to return
failure instead by passing NI_NAMEREQD in flags.

References: bugzilla elastic#240
Signed-off-by: Balazs Scheidler <bazsi@balabit.hu>
Legacy php code
Hi to All,
The Kibana 3 not talking directly to Elasticsearch from my browser...I have copied the kibana folder in my web apps folder in web server (Apache Tomcat 6) and configures my config.js as
var config = new Settings(
{
// By default this will attempt to reach ES at the same host you have
// elasticsearch installed on. You probably want to set it to the FQDN of your
// elasticsearch host
//elasticsearch: "http://"+window.location.hostname+":9200",
elasticsearch: 'http://localhost:9200',
kibana_index: "kibana-int",
modules: ['histogram','map','pie','table','filtering',
'timepicker','text','fields','hits','dashcontrol',
'column','derivequeries','trends','bettermap','query'],
}
);
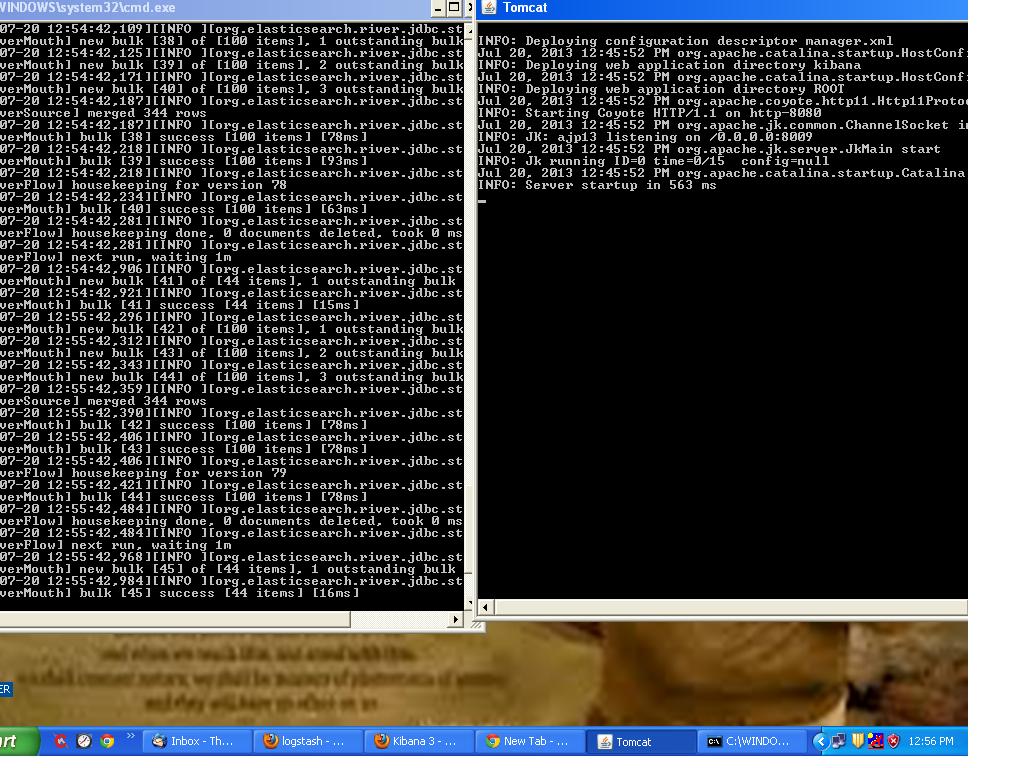
now i run the webserver and elasticsearch server
In browser i mentioned http://localhost:8081/kibana/#/dashboard and my result is
Oops! IndexMissingException[[logstash-*] missing] ....Why this error coming,if my kibana directly talking to my elastic search and more over in dashboard elastic search option is not working...
I have enquired regd the above error in this hub i am not able to get what i am expecting ?
I hope my requirements are clear if not i am ready explain explain..Kindly provide me a solution on this....
Pls find the attachment for your reference
The text was updated successfully, but these errors were encountered: