[APM] Correlations: Display latency distribution in a logarithmic scale #91574
Comments
|
Pinging @elastic/apm-ui (Team:apm) |
|
This ticket should also address other issues related to the inconsistent number of histogram buckets: |
|
Is the logarithmic scale supposed to be applied to the x or y axis? |
Only the x-axis (latency). Y-axis (occurrences) should still be linear. |
|
Here is a visualization I did with vega. The range query buckets were initially calculated with a
Here is the vega for the overall distrib visualization: {
"$schema": "https://vega.github.io/schema/vega-lite/v4.json",
"title": "latency log log hist",
"data": {
"url": {
"%context%": true,
"%timefield%": "@timestamp",
"index": "_all",
"body": {
"aggs": {
"ranges": {
"range": {
"field": "transaction.duration.us",
"ranges": [
{"from": 9160, "to": 9206.68528083349},
{"from": 9206.68528083349, "to": 9253.6085000345},
{"from": 9253.6085000345, "to": 9300.770870290751},
{"from": 9300.770870290751, "to": 9348.173610470603},
{"from": 9348.173610470603, "to": 9395.817945654559},
{"from": 9395.817945654559, "to": 9443.705107166918},
{"from": 9443.705107166918, "to": 9491.83633260761},
{"from": 9491.83633260761, "to": 9540.21286588417},
{"from": 9540.21286588417, "to": 9588.835957243893},
{"from": 9588.835957243893, "to": 9637.706863306139},
{"from": 9637.706863306139, "to": 9686.826847094817},
{"from": 9686.826847094817, "to": 9736.197178071017},
{"from": 9736.197178071017, "to": 9785.819132165829},
{"from": 9785.819132165829, "to": 9835.693991813305},
{"from": 9835.693991813305, "to": 9885.823045983616},
{"from": 9885.823045983616, "to": 9936.207590216358},
{"from": 9936.207590216358, "to": 9986.848926654031},
{"from": 9986.848926654031, "to": 10037.74836407571},
{"from": 10037.74836407571, "to": 10088.907217930813},
{"from": 10088.907217930813, "to": 10140.326810373183},
{"from": 10140.326810373183, "to": 10192.008470295194},
{"from": 10192.008470295194, "to": 10243.953533362119},
{"from": 10243.953533362119, "to": 10296.163342046639},
{"from": 10296.163342046639, "to": 10348.639245663551},
{"from": 10348.639245663551, "to": 10401.382600404628},
{"from": 10401.382600404628, "to": 10454.394769373672},
{"from": 10454.394769373672, "to": 10507.677122621746},
{"from": 10507.677122621746, "to": 10561.231037182579},
{"from": 10561.231037182579, "to": 10615.057897108149},
{"from": 10615.057897108149, "to": 10669.159093504462},
{"from": 10669.159093504462, "to": 10723.536024567498},
{"from": 10723.536024567498, "to": 10778.190095619351},
{"from": 10778.190095619351, "to": 10833.122719144538},
{"from": 10833.122719144538, "to": 10888.335314826514},
{"from": 10888.335314826514, "to": 10943.82930958436},
{"from": 10943.82930958436, "to": 10999.606137609655},
{"from": 10999.606137609655, "to": 11055.667240403549},
{"from": 11055.667240403549, "to": 11112.014066814012},
{"from": 11112.014066814012, "to": 11168.648073073278},
{"from": 11168.648073073278, "to": 11225.570722835486},
{"from": 11225.570722835486, "to": 11282.7834872145},
{"from": 11282.7834872145, "to": 11340.287844821929},
{"from": 11340.287844821929, "to": 11398.085281805346},
{"from": 11398.085281805346, "to": 11456.177291886692},
{"from": 11456.177291886692, "to": 11514.56537640088},
{"from": 11514.56537640088, "to": 11573.251044334596},
{"from": 11573.251044334596, "to": 11632.235812365298},
{"from": 11632.235812365298, "to": 11691.52120490041},
{"from": 11691.52120490041, "to": 11751.108754116727},
{"from": 11751.108754116727}
]
}
}
},
"size": 0
}
},
"format": {"property": "aggregations.ranges.buckets"}
},
"transform": [
{"calculate": "log(datum.doc_count)/log(10)", "as": "log_y"}
]
"mark": "bar",
"encoding": {
"x": {"field": "key", "type": "nominal", "axis": {"title": false}, "sort": {"ord": null}},
"y": {
"field": "log_y",
"type": "quantitative",
"axis": {"title": "latency"}
}
}
}For individual term fields, I simply added a filter query and kept the same ranges. Note the Note how Service 2.0 correlates highly (> 0.2) and has a very similar graph. Service 1.0 correlates highly in the other way (< -0.2), it has many missing buckets on the edges. It's effectively just that first "bump" (I couldn't get vega to allow many |

|
https://github.com/elastic/ml-aiops-poc/blob/master/aiops/log_log_hist.py implementates an algorithm that is effective at creating the parameters and values for log log histograms from ES data. Results are shown here: https://github.com/elastic/ml-aiops-poc/blob/master/notebooks/explore_eden_log_log_hist.ipynb. In addition the visuals produced by pandas by the mechanism look good and can provide a reference for visuals in this space. |
|
This is being implemented by the ML team. |
Currently the latency distribution chart in correlations show the data in a linear scale with 15 buckets:
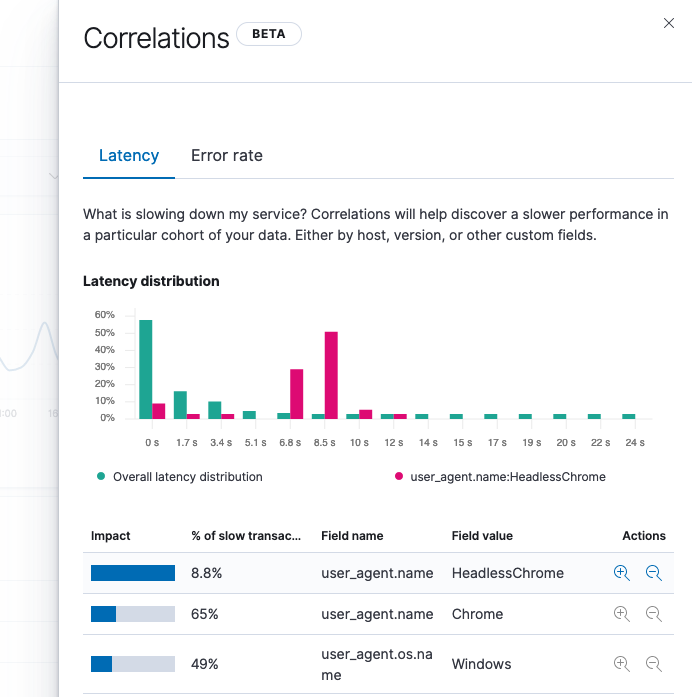
We should instead render a chart with a logarithmic scale so that small amount in extreme cases will still be visible to the user.
The text was updated successfully, but these errors were encountered: