This has been tested with python3.4
pip install -r requirements.txt
ALL DATASETS ARE LICENSED BY CRITEO. CONTACT THEM FOR PERSONAL ACCESS TO THE DATA. DO NOT ACCESS THE DATA WITHOUT A LICENSE.
Criteo Conversion Dataset
Available @ http://labs.criteo.com/2013/12/download-conversion-logs-dataset/
~1.5 Gb, 15mil clicks
Dataset construction:
The dataset consists of a portion of Criteo's traffic over a period of two months. Each row corresponds to a display ad served by Criteo and subsequently clicked by the user...
See Modeling Delayed Feedback in Display Advertising
Criteo TB Dataset
NC: there is no timestamp available. the highest grain date is 'day'
See http://labs.criteo.com/2013/12/download-terabyte-click-logs-2/
for i in {0..23}; do
    curl http://azuremlsampleexperiments.blob.core.windows.net/criteo/day_${i}.gz | \
        gzip -d | wormhole/bin/convert.dmlc -data_in stdin -format_in criteo \
        -data_out day_${i} -format_out libsvm
done
See run.py for an easy CLI interface -
python3.4 run.py experiment \
            --experiment-id=30_mins \
            --interval-secs=1800 \
            --model-params='{"learning_rate":0.1, "l1_regularization_strength":0.5, "l2_regularization_strength":0.5}' \
            --data-params='{"shuffle":False, "num_epochs":1}'
Experiments will log results to the specified file per partition step:
{
  "hyperparameters": {
    "model": {
      "l2_regularization_strength": 0.5,
      "l1_regularization_strength": 0.5,
      "learning_rate": 0.1
    },
    "data": {
      "shuffle": false,
      "num_epochs": 1
    }
  },
  "experiment_id": "30_mins",
  "metrics": {
    "global_step": 18.0,
    "label/mean": 0.2661654055118561,
    "loss": 18.612567901611328,
    "prediction/mean": 0.21581190824508667,
    "average_loss": 0.16793294250965118
  },
  "partition": 2,
  "interval_seconds": 1800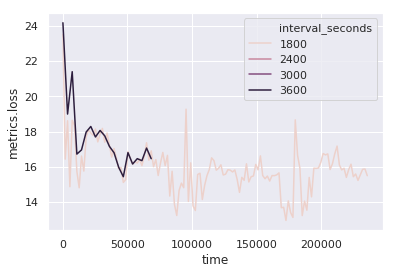
}See example_nb.ipynb
df = read_experiment_df("data/experiment.log")

sns.lineplot(
    x="time",
    y="metrics.loss",
    #col="interval_seconds",
    #kind="line",
    hue="interval_seconds",
    data=df
)